Storj V3 Telemetry Logging and Graphing with Grafana

Decentralised technologies interest me greatly. A sub-section of this genre is decentralised storage, which got its first mass debut with Napster. Napster was a “hybrid” model in that it used servers to coordinate peers… but not long after Napster other peer-2-peer services came along, like Kazaa, Kademlia (the basis for a myriad of p2p services), BitTorrent and very recently the boldly named InterPlantaryFileSystem RAWR. None of these protocols support monetisation. They are embodiments of the sharing economy.

More recently, companies have tried to produce decentralised storage systems which do monetise data storage. The big recent names have been Sia, Ubbey and Storj, with perhaps Urbit hanging around in the background. All of these fledgling systems have had major issues associated with them, which is an interesting discussion in itself. I’ve experimented with at least Sia and Ubbey previously.

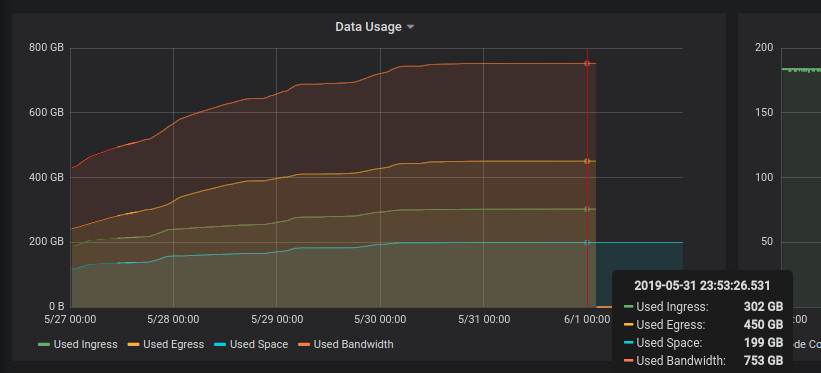
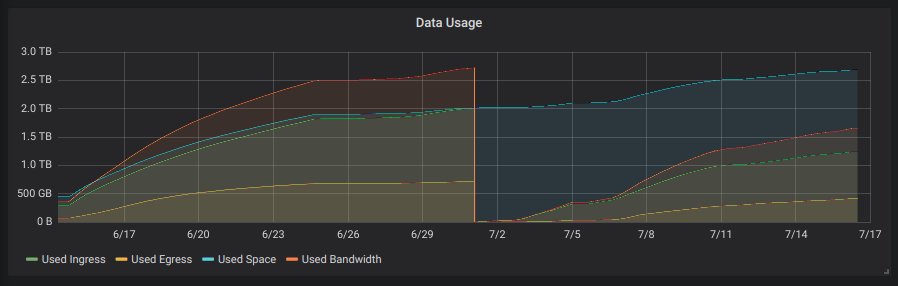
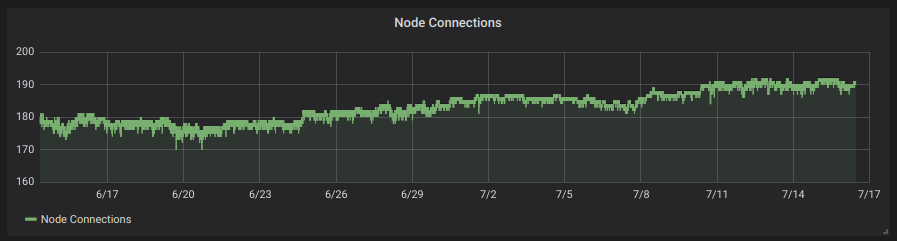
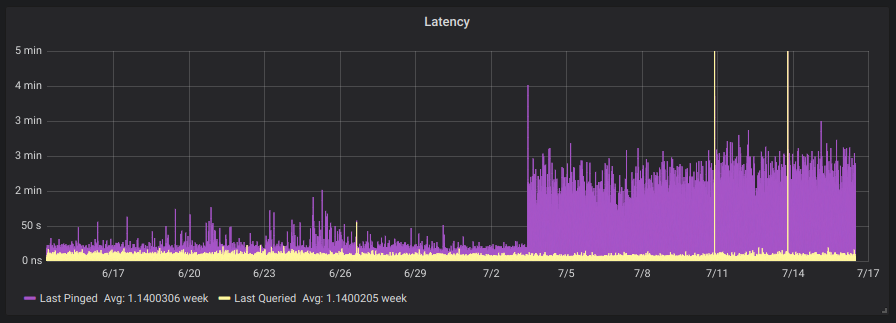
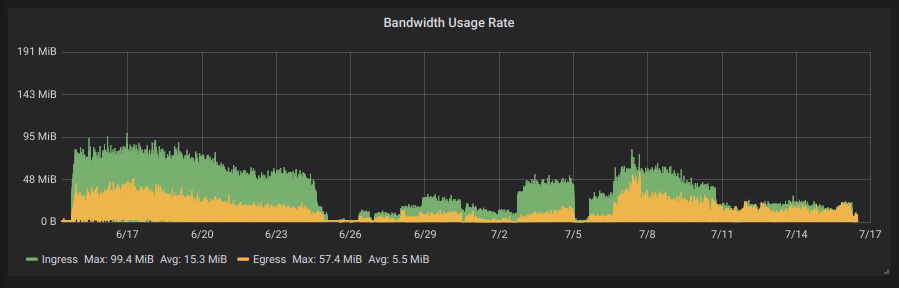
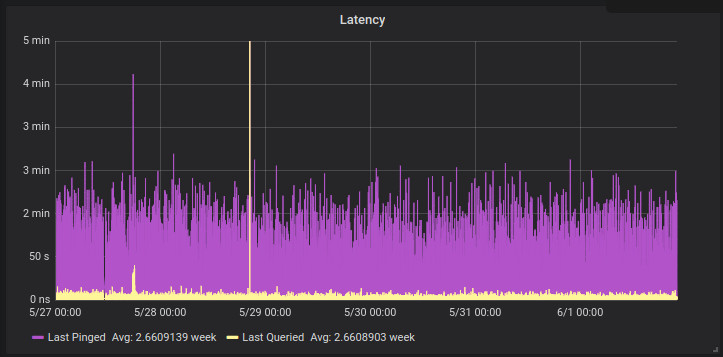
Storj recently announced that they were going to completely overhaul their network based on lessons learnt from their current system (v2) and asked for testers for their new system. I signed up and so far their software has been stable. I’ve written a small app which grabs telemetry from their daemon and inserts it into a Postgres database. Grafana is then used to graph this data.

Grafana Graph showing storage node storage usage
StorageNode data utilisation graph
Storj Storage Node egress, ingress and storage utilisation over the course of a month.
Node connections… is this the entire network ?
Storj Storage Node “Latency”
Bandwidth Usage

To get a small logging system going you’ll need to do this :

Launch a Postgres instance on your Docker-enabled machine :

docker run --name storj-pg --restart=always -v /home/yourhome/pgdata:/var/lib/postgresql/data -d -e POSTGRES_USER="storj" -e POSTGRES_PASSWORD="storj" postgres

Launch Grafana (if you don’t already have it) :

docker run --restart=always -d -p 3000:3000 --name=grafana -v /home/yourhome/grafana-data:/var/lib/grafana --link storj-pg:storj-pg grafana/grafana
# You can also use a network to link these machines, which is the new way of doing things and is a fair bit sexier than the "link" directive.

and then launch my app (to generate the initial config) :

docker run -ti --rm --detach=false -v /home/yourhome/telemetryconfig:/config aquarat/storj-postgres-logger:0.3a app -configfile=/config/config.json

My app will create a config file in the host directory, which you will need to modify to suit your installation. Once that’s done, relaunch it to check it works :

docker run --detach=false --rm --link storj-pg:storj-pg --link storagenode:storagenode -v /home/yourhome/telemetryconfig.json:/app/config.json aquarat/storj-postgres-logger:0.3a

Once you know it works you can relaunch it in the background :

docker run -d --name="pg-logger" --restart=always --link storj-pg:storj-pg --link storagenode:storagenode -v /home/yourhome/telemetryconfig:/config aquarat/storj-postgres-logger:0.3a app -configfile=/config/config.json

You can monitor the logger with docker logs -f pg-logger

The payload inserted into the table will look like this :

{"node_id":"xxxTz8ZhctRT7SmdWmwVMYYGhab1BkL2HXEH9LfCjvgBHTyEKvF","node_connections":183,"bootstrap_address":"bootstrap.storj.io:8888","external_address":"hansie.com:28967","stats":{"used_space":136240764928,"available_space":7863759235072,"used_ingress":213188739072,"used_egress":284742114304,"used_bandwidth":497930853376,"available_bandwidth":19502069146624},"uptime":{"seconds":1616778,"nanos":894016912},"last_pinged":{"seconds":1558951645,"nanos":705568818},"last_queried":{"seconds":1558951645,"nanos":938984110}}

The associated Grafana query to pull these values out of the database looks like this :

Storj StorageNode Latency Graph showing ISP glitch
Grafana graph showing StorageNode Latencies with an ISP “glitch” on the 29th of May 2019.

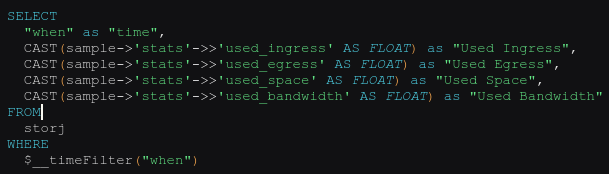
Of course Docker isn’t required for any of this and “links” are only needed when containers aren’t on the same docker network.

Reverse Engineering the Ubbey Box

Some time ago I came across an ICO (distressed choir wails in the background as if welcoming lucifer to a dark cathedral) and said ICO was aiming to build a decentralised storage system. “Cool”, I thought, eager to experiment with a small amount of Ethereum on a diverse set of ICOs. I gave them some ETH… but before doing so I discovered that decentralised storage isn’t a new thing. Several projects have tried (and somewhat succeeded) in building dencentralised storage networks already; big examples being BitTorrent and IPFS being (neither offer in-band remuneration). In addition, cryptocurrency-supported examples include SiaCoin and StorJ – both of which have serious issues. After contributing to the Ubbey/Universal Labs ICO I decided to give Sia hosting a try… but that’s another story.

Ubbey’s 2000 Ethereum ICO was ultimately successful and I got some tokens. Shortly thereafter Ubbey allowed ICO participants to use some of their tokens to order their “Ubbey Box” at discounted rates. By this stage I had acquired additional Ubbey tokens at a fraction of the ICO price on decentralised exchanges (I love DEXs). Yesterday, the Ubbey box I ordered arrived. I only recently got a chance to play with it.

As with most boxes I don’t control, the Ubbey box has gone onto a DMZ network, which means it can’t access my home security cameras, storage machines, geyser controller, irrigation controllers… you get the idea.

First things first, unpacking :

Very nice Ubbey… the packaging looks good, even after being bashed around by DHL.

An Ubbey Box, by Universal Labs

This box is very obviously a general purpose media player that’s been rebranded to fit Ubbey’s needs. There’s nothing wrong with that, it’s sensible. They inadvertently hint at it being a general purpose media box with their specs, which quote the device as having an ARM CPU in it with 2 GBs of RAM, a VERY common configuration for ARM dev boards from around 2 years ago. This is begging to be disassembled…

So, onto the DMZ it goes. I installed the Ubbey app from the Google Play Store and soon enough it found the box (through what looked like an IP scan of the local subnet). The scan was followed by a login prompt and then a firmware update (forced) :

Unfortunately, it’s been about 2 hours now and it’s still updating…

While we wait for it to update, let’s see what’s inside :

This is how the device looks inside with the lower cover removed (it’s upside down in this shot).
The Ubbey logo is illuminated by an over-spec’ed 7-segment LED display.
The top-side of the main board of the Ubbey Box.

The top side of the main board of the Ubbey Box is -very- interesting. The device is equipped with a dual-chain/MIMO wifi module and the box has antennas for it installed. The top cover of the box has a large metal mass, which is squeezed against the top of that shielded cage/case with a thermal pad sandwiched inbetween. The board is clearly designed to have multiple display outputs with one set of traces unpopulated. The FORESEE module is probably flash “ROM” storage for the OS, which is OpenWRT. Also present are traces/holes for a TTL UART, an SD Card module and two USB ports (one of which appears to be USB 3).

It should be noted that the Ubbey Box runs an SSH daemon by default – attempts to log in to it using root/root, root/password, root/etc. proved fruitless.

The top side of the Ubbey Box PCB with the CPU/RAM shield/case and thermal pad removed.

A quick Google search for SEA Beelink SEA I found me this Amazon page :

Wireshark packet sniffing indicates that the device spends a lot of time communicating with 47.100.119.151, which seems to reverse-resolve to api.yqtc.co. Visiting the server with https indicates that the server’s HTTP certificate expired in May… so I thought the client device may be less than strict with it’s certificate acceptance. Some DNAT rules on my router and mitmproxy later and I got this :

mitmproxy is very cool software. Unfortunately the Ubbey Box’s Go client, although permissive, isn’t that permission 😉

It would appear that the best way of gaining access to this device is via the TTL UART.

Update 22 September 2018 : Serial Debug Console

Not my neatest work, but I now have access to the device’s debug console…
Part of the Ubbey Box’s boot process and the OpenWrt failsafe mode entry point.
The Ubbey Box’s labeled partitions.
The contents of description.xml inside what looks like an overlay filesystem called “nasetec”

More to follow…